
All eyes seem to be on Nvidia’s upcoming earnings report. The cryptocurrency market, especially Bitcoin, seems to have moved in parallel with the bearish environment in US stocks today. The statement to be made by Nvidia, artificial intelligence It has the potential to provide clues as to whether the supported bull market continues to exist or whether the rally is starting to lose momentum, and the situation may also be seen to be turning into a turning point.
Nvidia Expectations and Cryptocurrencies
Analysts surveyed by FactSet say Nvidia could have earned adjusted earnings of about 65 cents per share in its second quarter, while they think its revenue could have been $28.74 billion. The figure would more than double earnings compared to the same period in 2023. A Prize Pool Worth 21 Million TL Awaits You from BinanceTR! Participating and winning has never been easier.. You can sign up to BinanceTR from this link. Get your first crypto!
On the other hand, Nvidia’s revenues had more than tripled year-over-year in April, which could mean a slowdown in growth. This situation at Nvidia has also dragged the Nasdaq side into uncertainty, and now all eyes seem to be on the upcoming announcement.
The cryptocurrency market, which had a 30-day average correlation coefficient of 0.40 with the Nasdaq 100 as of August 27 and maintained a positive correlation with the index throughout the month, also experienced a noticeable decline, especially Bitcoin.
Long/Short Balance in the Market
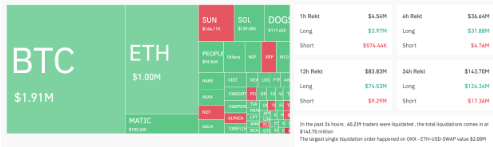
The crypto market crash saw $143.70 million worth of liquidations in the last 24 hours, $126.34 million of which were tied to long positions. Meanwhile, the crypto futures market’s open interest (OI) fell by approximately 1.80% over the same period.
The disappearance of a significant amount of long positions reflects that many traders are trading with high leverage.
Considering that the market is currently moving in the opposite direction of this outlook, it can be seen that a series of liquidations have emerged that are adding strength to the downward price movement. The situation in question generally brings about a rapid decline as loss termination and margin calls are made.
On the other hand, a decrease in OI indicates a decrease in active futures contracts, indicating that investors are closing their open positions and withdrawing from the market.
General Chart in Cryptocurrencies
The decline in cryptocurrencies led by Bitcoin today can be interpreted as a reflection of the movements in the general economic world. The price movements occurred after the market tested the upper trend line of the ongoing descending channel formation and a similar situation occurred to the scenario experienced in June and July.
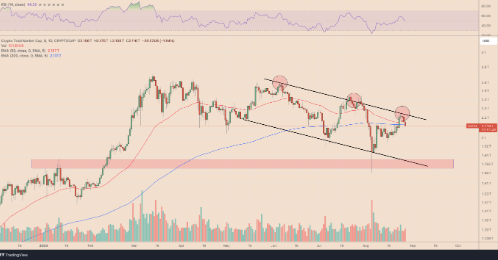
As of August 27, the market cap moved below the 200-day exponential moving average (200-day EMA; blue wave), an important indicator, and is in the $2.13 trillion area. The charts show that the channel in question is in danger of falling towards the lower trend line around $1.80-1.72 trillion.
Disclaimer: The information contained in this article does not contain investment advice. Investors should be aware that cryptocurrencies carry high volatility and therefore risk, and should carry out their transactions in line with their own research.