
In addition to Bitcoin, investors are also curiously following the status of altcoins that are in the top 10 in terms of volume and are immediately following them. As we start August 29, let’s take a look at the DOGE, ADA and AVAX charts while investors are wondering in which direction the price movements might be.
Dogecoin Price Analysis
Dogecoin turned down from the 50-day SMA ($0.11) on August 24 and fell below the 20-day EMA ($0.10) on August 26, making investors nervous. A Prize Pool Worth 21 Million TL Awaits You from BinanceTR! Participating and winning has never been easier.. You can sign up to BinanceTR from this link. Get your first crypto!
It is thought that DOGE may try to find support in the region between $0.10 and $0.09. It is thought that the bulls may try to push the price above the falling wedge and may have to protect it, in order to show that the current downtrend may be ending. DOGE’s It can be seen that this formation is trying to rise to $0.14 with the upward breakout of this formation.
On the other hand, if the price falls below the support zone, it can be interpreted that the bears still have the power. DOGE can be seen moving to the strong support of $0.08 and then even lower.
Cardano Price Analysis
Cardano (ADA) also started to decline on August 26 and fell below the 50-day SMA ($0.38). This was interpreted as a sign that demand for ADA may be decreasing.
While the price decline in ADA continued, it was later seen that it fell below the 20-day EMA ($0.36) on August 27. While there is a small support level in the uptrend line, the scenario where this level is broken may reflect on the charts that the price falls to $0.31.
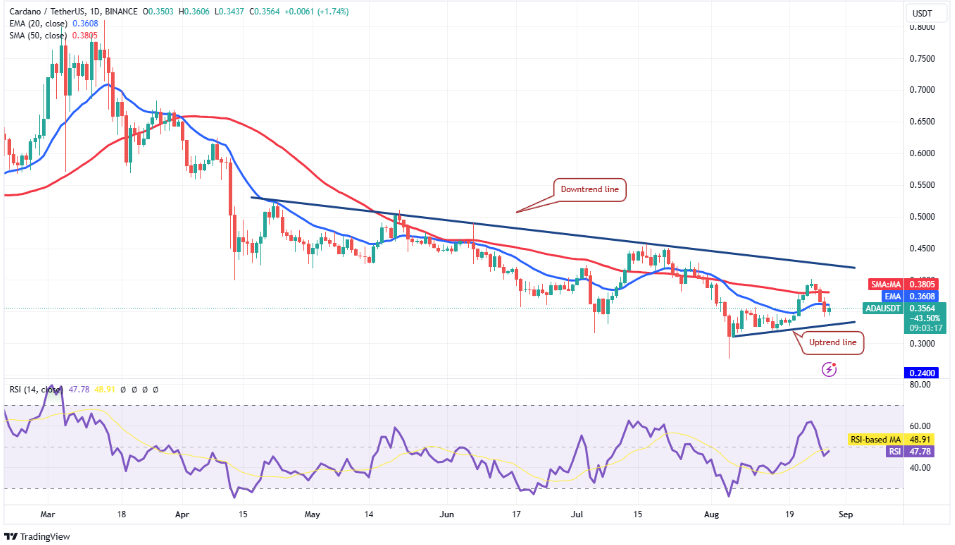
On the contrary, if the price rises from the current level with a possible trend reversal, it can also be seen that the bulls are trying to push the price back above the 50-day SMA. In this case, the probability of a rally towards the downtrend line may also be reflected in the charts.
AVAX Comments
Avalanche’s (AVAX) was seen to move down from the resistance line of the descending channel formation on August 25, and it was reflected in the charts that the bears did not allow an aggressive rise above this level.

After the bears pushed the price lower, there was a pullback to the 20-day EMA ($23.89), a key level for the bulls to defend. In the scenario where the price rebounds strongly from the current level, buying on dips can be seen.
This situation may trigger a rally above the channel. Accordingly, a view may occur in which the AVAX price first climbs to $33 and then to $37. However, in a bearish scenario, the price may fall to $19.50 and deepen, which may be reflected in the charts.
Disclaimer: The information contained in this article does not contain investment advice. Investors should be aware that cryptocurrencies carry high volatility and therefore risk, and should carry out their transactions in line with their own research.