At the time of writing Bitcoin (BTC) price We saw a drop of $59,160 and $57,701 in the last 24 hours. This week, BTC has tried to fall below $58,000 many times. So when will the demoralizing price movement that has been going on for months end? What levels should investors watch for BTC?
Bitcoin (BTC)
On the weekly chart, two formations stand out for BTC. On the other hand, Glassnode analysts have called the situation that has been going on for the last 5 months a “structurally organized downtrend.” This also reflects the weakness in the strength of BTC price momentum. Cryptocurrency analyst Skew points out that sharp fluctuations on the chart are linked to strong liquidations in futures. A Prize Pool Worth 21 Million TL Awaits You from BinanceTR! Participating and winning has never been easier.. You can sign up to BinanceTR from this link. Get your first crypto!
Looking at the current order book totals, spot bids are preventing a larger sharp decline for now. However, spot buying weakening at higher levels is also preventing major upward movements. This is triggering sharp movements in both directions.
On the technical front, a bullish to broadening wedge formation is forming. This suggests that accumulation between $52,000 and $48,000 and selling between $62,000 and $67,000 could be profitable. Since the liquidations triggered in the futures are in both directions, at some point $48,000 or $67,000 will need to be broken.
On the weekly chart BTC It keeps making lower highs instead of trying new highs. MACD As the distance between the and signal line widens, we may be seeing signs of a losing streak similar to 2018 and 2021. Similarly, RSI climbed to 88.47 in March when the spot price saw the ATH level, and then fell to 44 in August.
Crypto is now a much more global asset, and macroeconomic and geopolitical developments remind us that there are different triggers in our lives beyond their own internal dynamics with declines/rises. This supports the idea that investors may experience periods different from previous cycles.
BTC and Volume
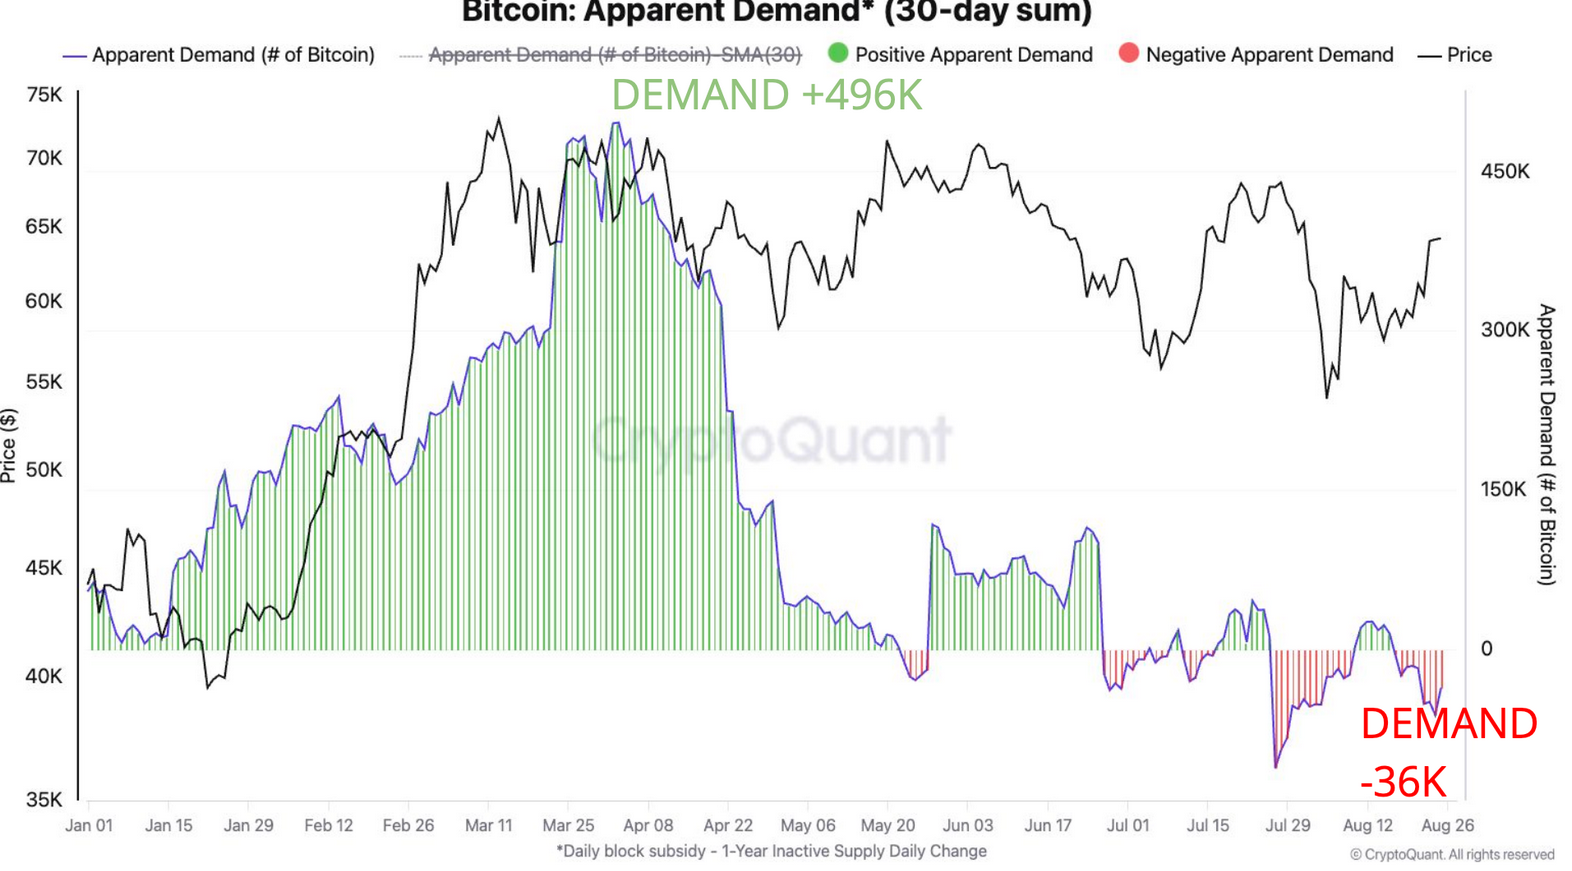
CryptoQuant The report notes a long-standing lack of volume associated with the summer months. According to CryptoQuant, Apparent Demand is the difference between the total daily Bitcoin block supply and the daily change in the amount of Bitcoin that has remained constant for a year or more. The report notes a significant easing of Apparent Demand.
“Demand has slowed from 30-day growth of 496k Bitcoin, the highest since January 2021, to current negative growth of 36k. As demand has slowed, prices have also slowed from ~$70k to $49k.”
Disclaimer: The information contained in this article does not contain investment advice. Investors should be aware that cryptocurrencies carry high volatility and therefore risk, and should carry out their transactions in line with their own research.