
On October 19, Dogecoin was priced at $0.14408. Since then, it has dropped 7.09%, now sitting at $0.13440. This price remains well above its 200-day Simple Moving Average (SMA) of $0.12758, as shown on the daily chart. Currently, Dogecoin’s price momentum presents mixed signals, with some indicators suggesting a downturn while others hint at a possible rally.
What do analysts predict for Dogecoin’s next big move? Let’s dive in!
Is Dogecoin Losing Momentum?
At the start of the month, Dogecoin was priced at $0.11413. Until October 13, the market showed sideways movement, struggling to break above the opening price of October 1. The daily chart shows a Doji candlestick formed on the 13th, indicating a close contest between buyers and sellers.
On October 14, buyers gained the upper hand, pushing the price above the opening price of October 1 to a high of $0.11658. By October 19, DOGE reached a monthly peak of $0.14408. Between October 13 and 19, the market saw an impressive surge of at least 29.44%. However, the current price of $0.13488 reflects a decline of nearly 7.09% from that peak.
Investor Sentiment Turns Bearish
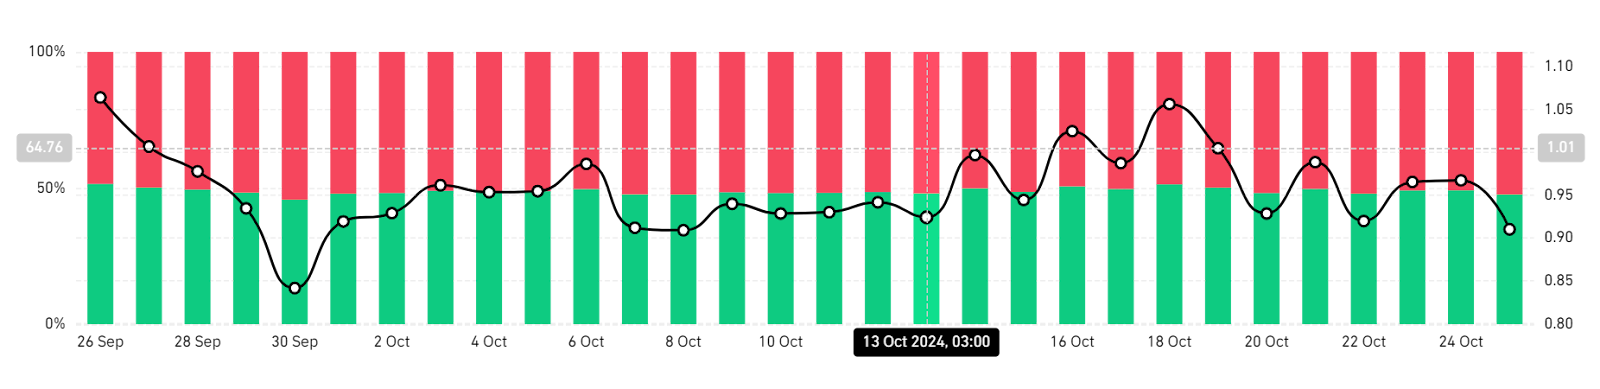
Data from Coinglass shows that 52.35% of investors have opted for short positions in the last 24 hours. This trend suggests that more investors expect a near-term drop in DOGE’s price. Additionally, the DAA (Daily Active Addresses) divergence of Dogecoin’s price indicates a weakening bullish momentum, as it has remained negative over the past week.
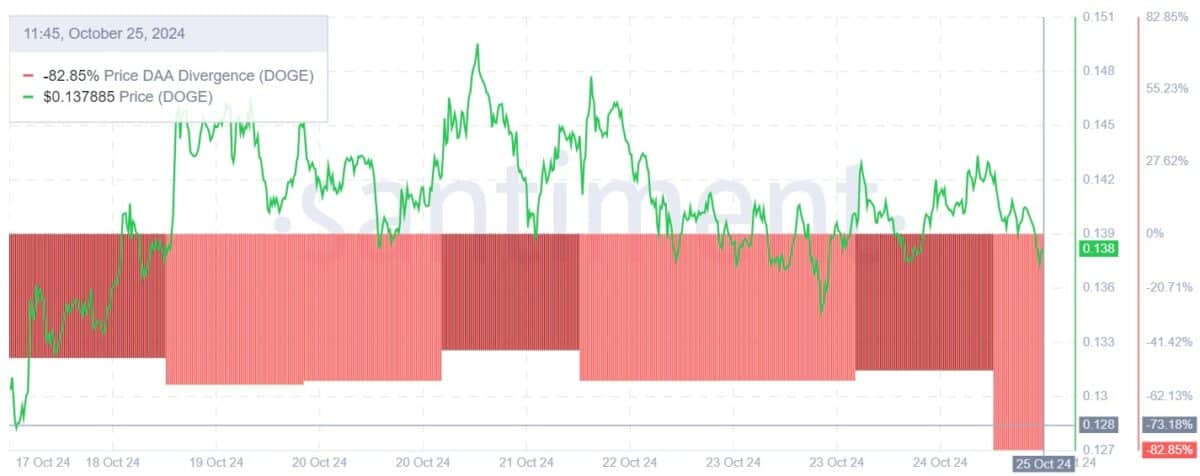
Some crypto analysts warn that if this bearish trend continues, the DOGE market could see further declines.
What the Indicators Tell Us
Despite the bearish sentiment, the Directional Momentum Indicator on Dogecoin’s daily chart suggests a bullish trend. The +DI value is at 25.9254, above the -DI value of 15.7939, while the ADX index stands at 30.9689, remaining at least five points higher than the +DI value. The ADX line rises above both the +DI and -DI lines, with the +DI consistently above the -DI, indicating strong bullish potential.
Furthermore, Dogecoin broke through the 200-day SMA on October 18 and continues to trade above this key level. The 50-day SMA is approaching the 200-day SMA, suggesting that a golden cross could happen soon, a pattern often associated with significant bullish momentum.
Golden Cross Ahead?
The possibility of a golden cross is even clearer in Dogecoin’s weekly chart. This pattern is widely seen as a powerful bullish signal, with the last occurrence in 2021 leading to a massive rally.
- Also Read :
- Top 5 Memecoins To Watch During This Crypto Dip!
- ,
Some analysts predict that if DOGE can maintain its position above the 200-week SMA, it could experience a rally of up to 200%.
In summary, Dogecoin is at a critical point, with indicators reflecting both bearish and bullish trends. Investors will be watching closely to see which direction DOGE ultimately takes.
In the world of crypto, anything can happen. Will Dogecoin bounce back, or is it time to control our expectations? Keep your eyes peeled to Coinpedia to know more.