
Global markets are in chaos following President Trump’s new “Liberation Day” tariffs and a sudden liquidity crunch. This has triggered one of the sharpest crypto market corrections since 2020. While Bitcoin is holding up relatively well, Ethereum is facing much heavier losses – raising an important question: Why is ETH falling more than BTC? Let’s take a closer look.
Markets Worldwide Are Under Pressure
Over the past week, major markets around the world have come under serious pressure. The US stock market is down 0.68%, Europe has dropped 4.65%, China is down 3.28%, India 3.53%, and Australia 1.21%.
The sell-off has also hit other major assets, especially those closely linked to the US economy. Since April 1, WTI crude oil prices have fallen by nearly 13.79%. Even gold—usually seen as a safe haven—has dropped over 4.74% between April 3 and 7.
The situation in the cryptocurrency market is not different. In the last seven days, the top two cryptos, Bitcoin and Ethereum, have slipped by at least 1.1% and 11%, respectively.
It appears that the economic mayhem has inflicted more injuries on Ethereum, compared to Bitcoin.
Ethereum Sees Bigger Capital Outflows
A new research report gives us some answers. At its peak, Ethereum was seeing capital inflows of +$15.5 billion per month. Now, it’s facing outflows of -$6 billion per month.
Bitcoin’s inflows have slowed too—but they’re still positive at +$6 billion per month. This shows that investor confidence in Bitcoin remains stronger than in Ethereum.
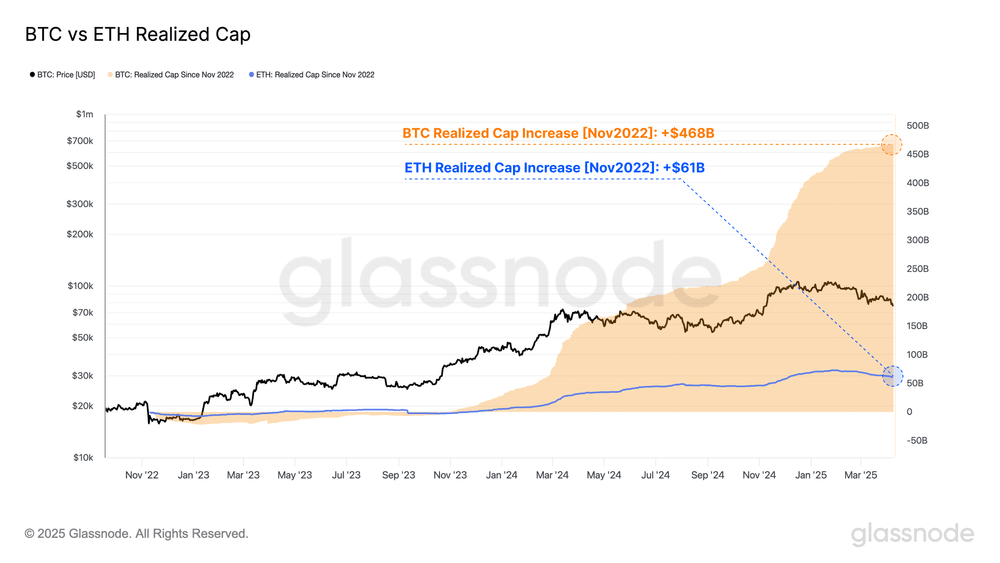
The Realised Cap chart comparing BTC and ETH also tells an important story. Since late 2022, Ethereum’s realised cap has grown by just 32%—from $183 billion to $244 billion. In comparison, Bitcoin’s realised cap has jumped 117%, going from $402 billion to $870 billion.
This means that, in this cycle, Bitcoin has attracted far more investor demand than Ethereum.
MVRV Ratio Shows ETH Holders Are in Loss
The MVRV (Market Value to Realised Value) ratio shows another reason for ETH’s underperformance. ETH’s ratio has dropped below 1.0, meaning the average holder is now at a loss. Bitcoin’s MVRV ratio, on the other hand, is still above 1.0—so most BTC holders are still in profit.
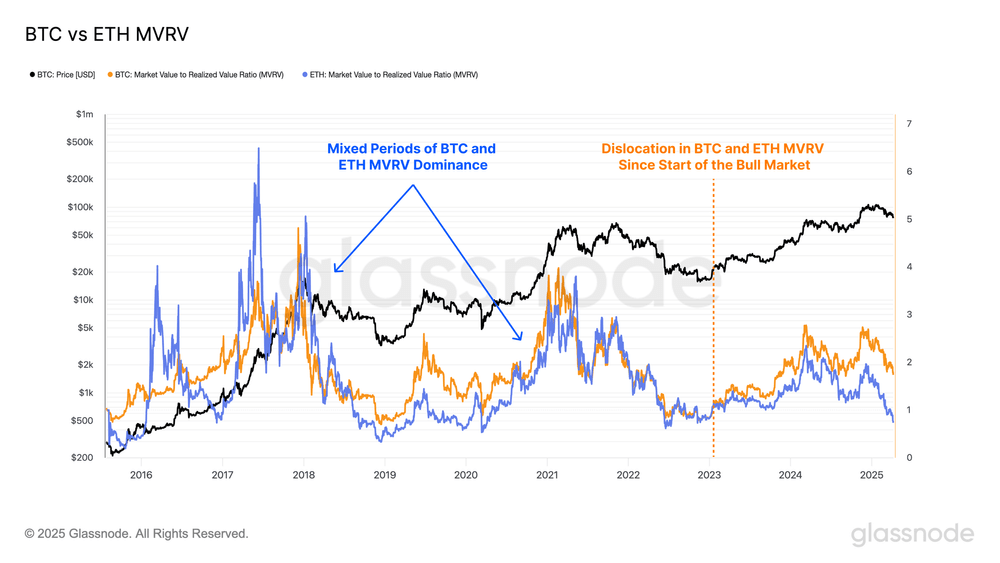
When investors are in loss, they’re more likely to sell—adding to the selling pressure on ETH.
BTC Has Outperformed ETH for Over 800 Days
The report points out that Bitcoin holders have enjoyed higher average profits than ETH holders for 812 straight days. This long period of underperformance has further weakened sentiment around Ethereum
ETH/BTC Pair Shows Ethereum Losing Ground
Since September 2022, the ETH/BTC pair has fallen by at least 75%. At the start of April, it stood at 0.02207. Since then, it has dropped another 11.46%.
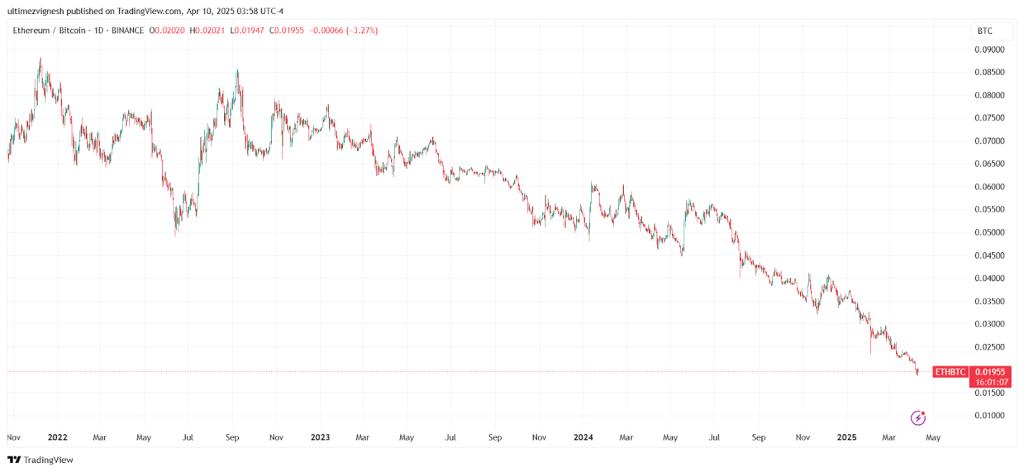
This shows just how much Ethereum is underperforming compared to Bitcoin in this cycle.
What’s Next: Can ETH Recover Its Momentum?
During the most recent sell-off, Ethereum investors locked in $564 million in realised losses—more than double the $240 million in losses for Bitcoin holders. This highlights just how much more pain ETH investors are feeling.
In past bull markets, Ethereum would often outperform Bitcoin at certain points. But in this cycle, that hasn’t happened—and it’s hurting investor confidence.
With capital flowing out, sentiment weakening, and key metrics showing deeper losses, Ethereum’s underperformance may continue unless a strong bullish shift takes place. For now, the market seems to prefer Bitcoin as the safer bet.
Never Miss a Beat in the Crypto World!
Stay ahead with breaking news, expert analysis, and real-time updates on the latest trends in Bitcoin, altcoins, DeFi, NFTs, and more.
FAQs
While Ethereum is trusted for its stout fundamentals, Bitcoin continues to dominate with its widespread adoptions.
As per our Ethereum price prediction 2025, the ETH price could reach a maximum of $5,925.
As per our latest ETH price analysis, Ethereum could reach a maximum price of $123,678.
By 2050, a single Ethereum price could go as high as $255,282.