
Stellar $0.452888 (XLM) Altcoin attracts attention with its reverse shoulder head shoulder (OBO) formation on the daily graph. The appearance on the price chart reminds the route that XRP has been watched since the beginning of the year. The price is about $ 0.452 just below the $ 0.50 neckline, which is seen as a passage of a strong rise. At the beginning of the year, XRP had risen from a similar structure and increased the neck line. XLM For Fibonacci extension levels indicate $ 0.71 (1,618) and $ 0.77 (1,786), but for this, the remarkable interest is required.
Reverse shoulder head shoulder formation in XLM
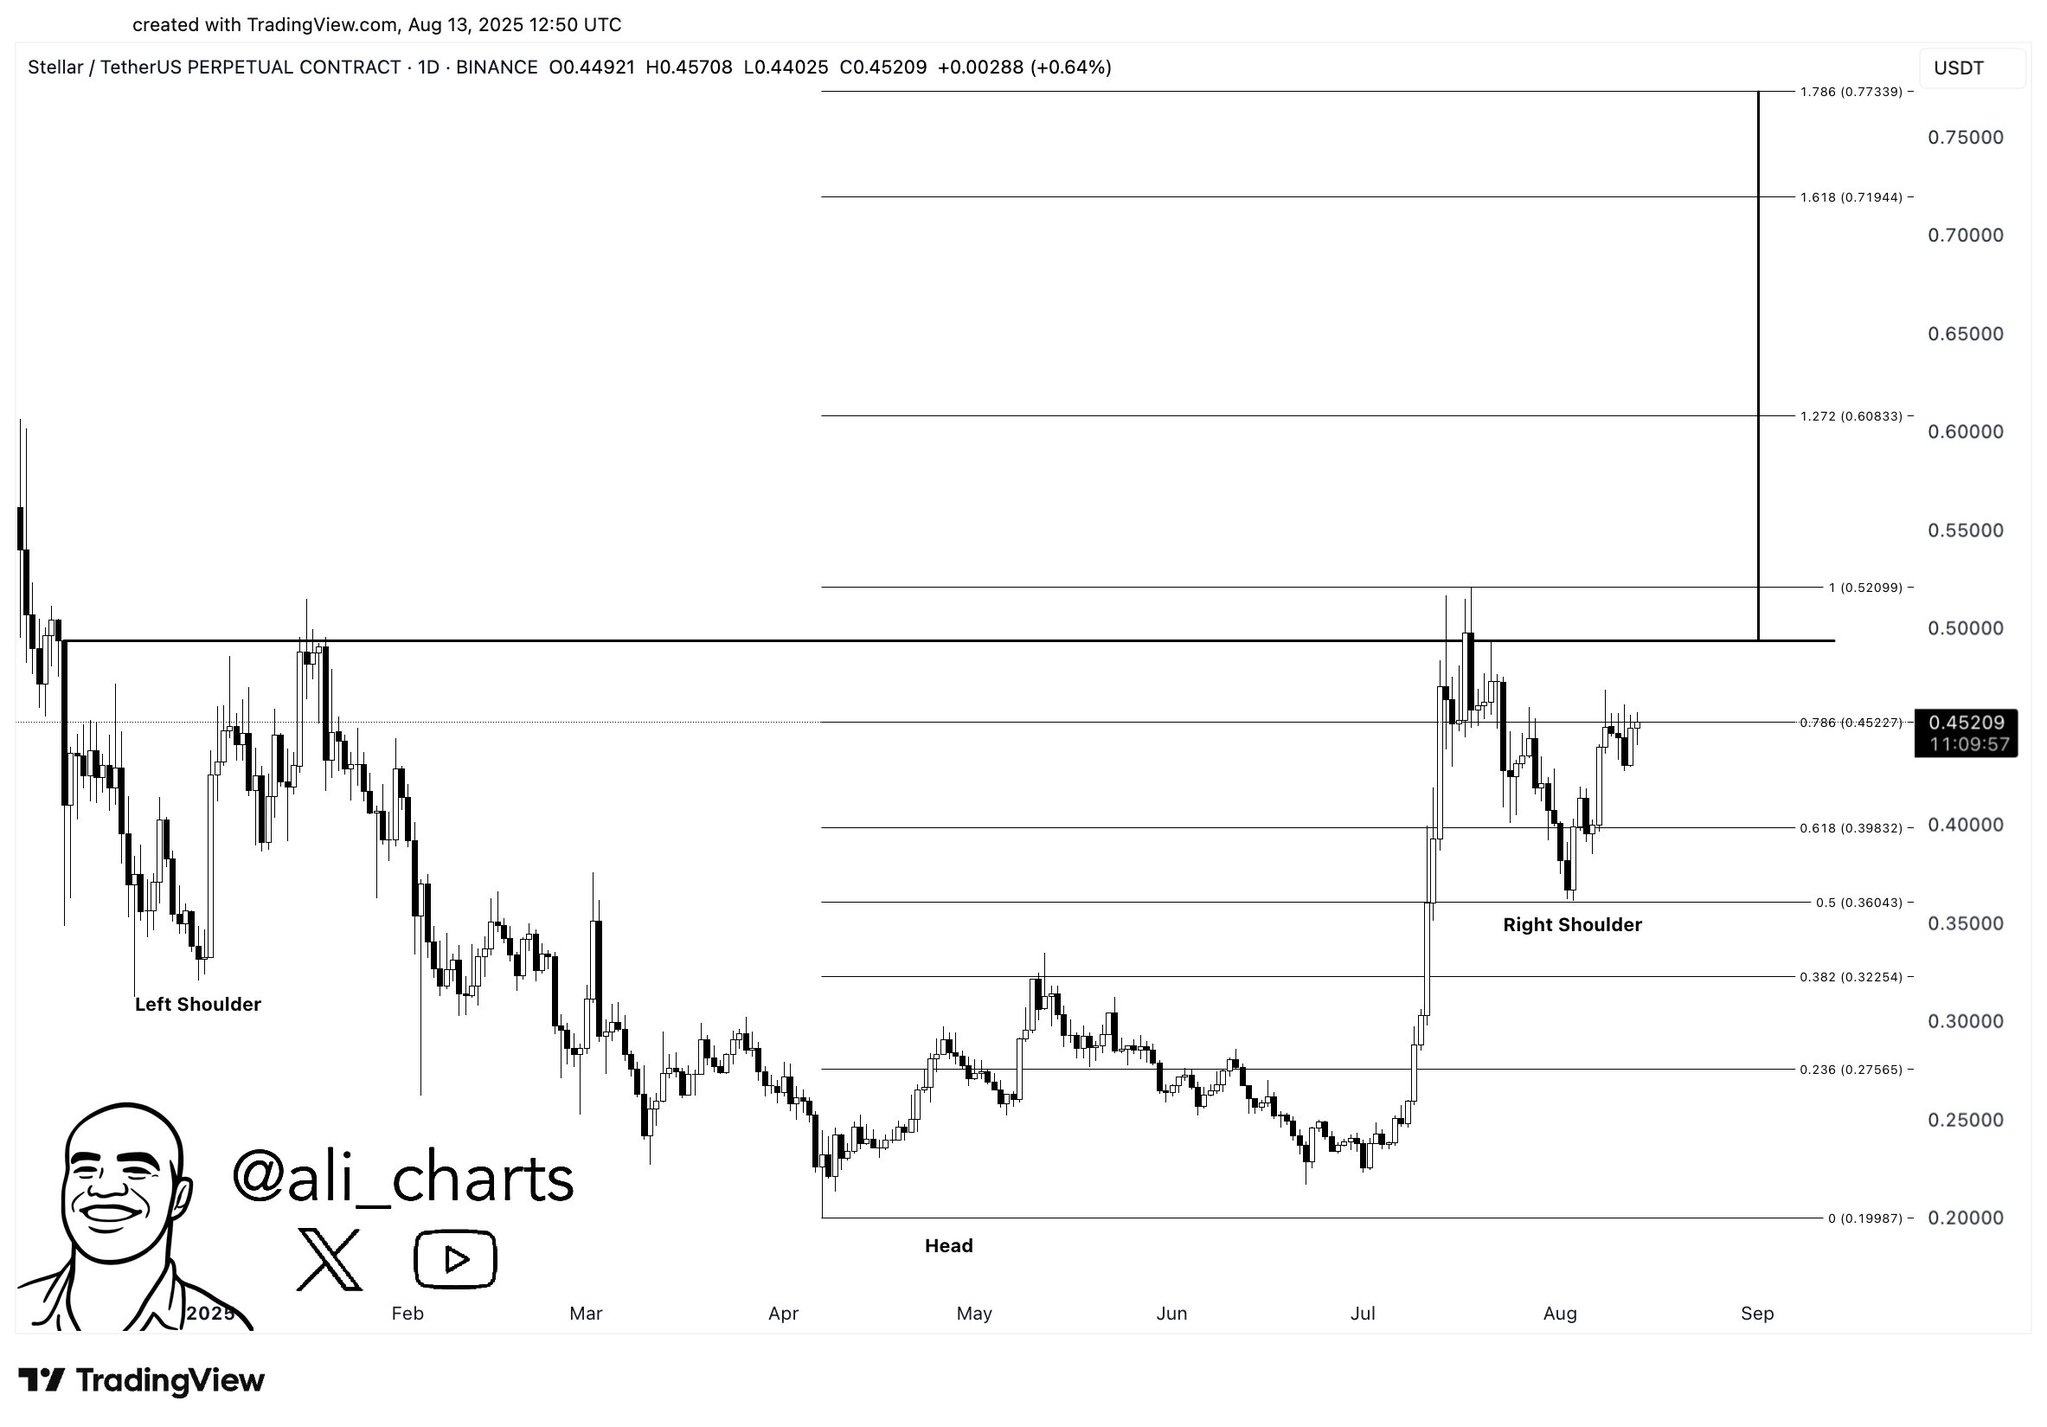
Analyst Ali Martinez’s pointed out and formed in the daily graph Reverse shoulder head shoulder The left shoulder formation of the formation stretched to January, while the deep head formation was formed in late May, and the right shoulder has been in the process of completion since the beginning of this month. The formation of formation emphasizes the level of $ 0.50, which is a psychological and technical threshold, according to those who follow graphics. This clearly clear of the neckline offers a clear image of where a possible acceleration change will be confirmed.
The reminder of the formation is also quite remarkable. Altcoin at the beginning of the year XRP There was also a similar formation, then the neckline was broken and the price had risen with double digit. XLM Coin On the side, the opening of the same road map depends not only on the presence of the formation, but also the volume at the time of break.
POSSIBLE Formation Fracture and Reddness Scenario
Formation breakageIn order to be considered reliable, a daily candle closure over $ 0.50 is required and a healthy volume is required. If this double confirmation does not occur, the price of the price to the support of $ 0.40, even the next support threshold of $ 0.36 is likely to return to the table. These levels correspond to the withdrawal thresholds that can be monitored when the formation does not work.
Fibonacci extension levels will be guiding if the break occurs. 0.71 dollars corresponding to the extension level of 1,618 stands out as the first measured target, while $ 0.77 corresponding to 1,786 points to the next target zone. In order for the price to walk to these target levels, the demand should continue after formation breakage and the volume should increase. Otherwise, the price may continue to move around the neckline of the formation.

Responsibility Rejection: The information contained in this article does not contain investment advice. Investors should be aware that crypto currencies carry high volatility and thus risk and carry out their operations in line with their own research.