
Bitcoin  $86,989.86Although it fell to 88 thousand dollars with a sudden drop on Monday, it climbed above 90 thousand dollars again in a short time, giving a strong recovery signal to investors. Although there has been a small retreat in the last 24 hours, some data show that the rise is still on the table.
The most important factor behind the mentioned rise was the US Federal Reserve’s termination of quantitative tightening and the increasing expectation of a 25 basis point interest rate cut after the FOMC meeting to be held next week.
Fed’s Dovish Tone Brings Re-Momentum to Crypto
The Fed’s pursuit of a more dovish policy makes investment instruments with a high risk appetite more attractive to investors. This situation is expected to create new capital inflow, especially into the cryptocurrency market. However, it is still unclear whether this flow will be strong enough to push Bitcoin to new highs.
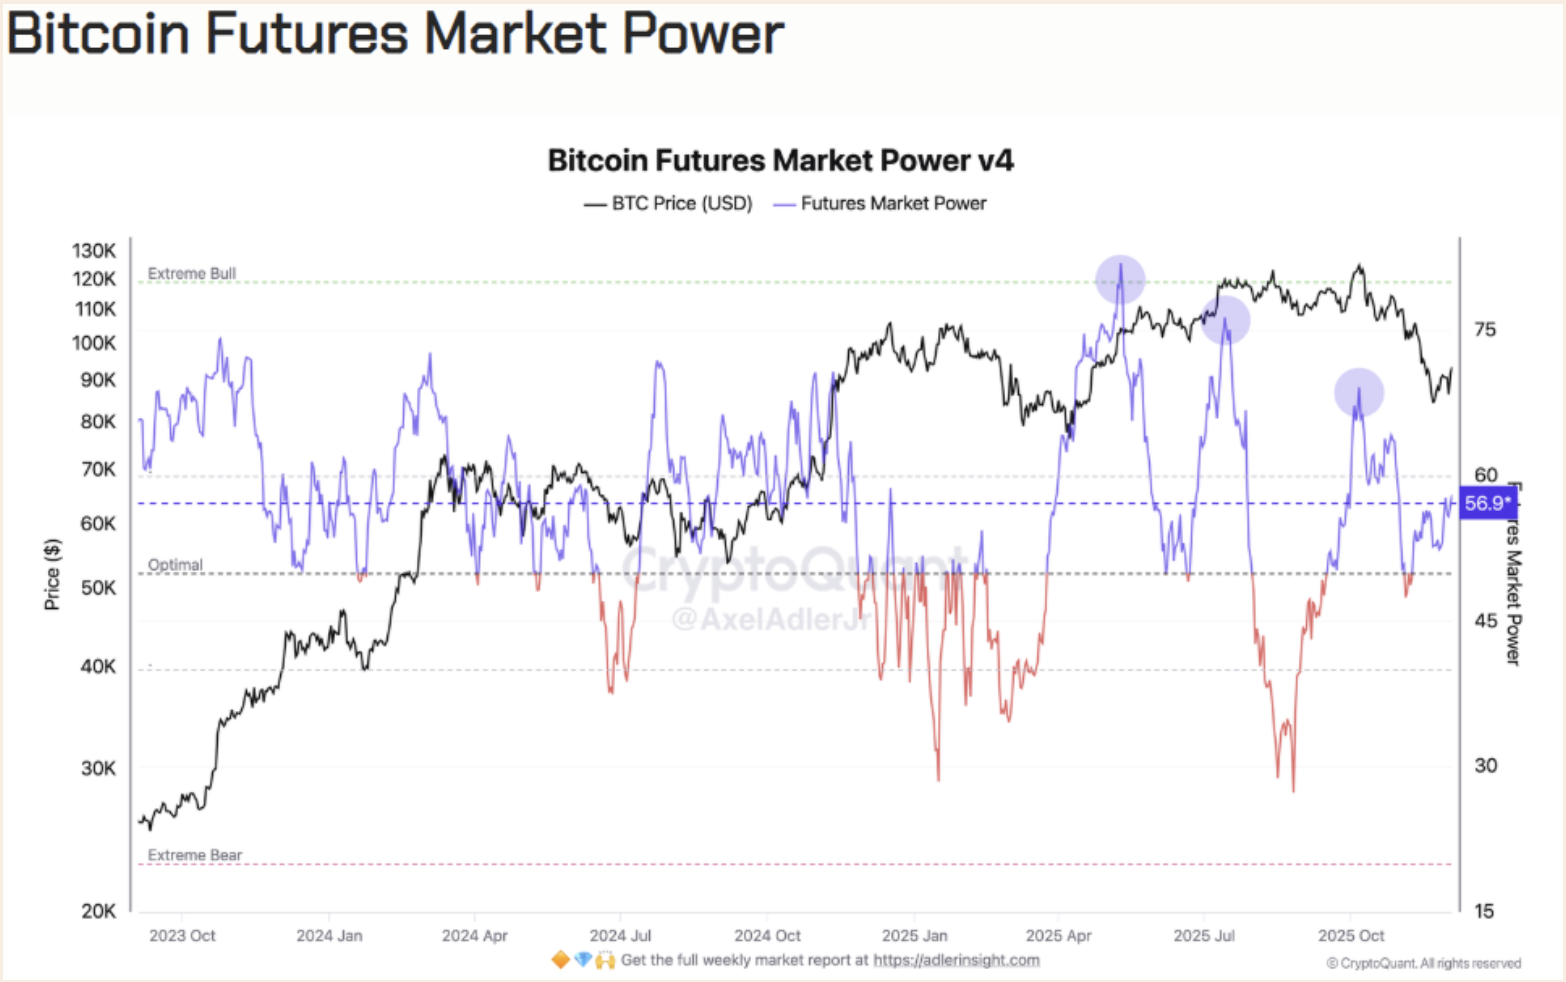
Crypto analyst Axel Adler announced that an important indicator in Bitcoin’s derivatives market is giving a “bull signal”. According to Adler, the Bitcoin Futures Market Power index reached 56.5, creating a bullish sign. This metric; It measures the pressure of the Bitcoin derivatives market by combining open interest amount, funding rates and buyer-seller balance. The index moving above the 60 level is seen as a strong bullish confirmation. On the other hand, falling below 50 may mean moving into the decline zone again.

On-Chain Data Points to the Market Searching for a Bottom
On-chain indicators also indicate that Bitcoin may have formed a local bottom. In particular, the fact that the Coinbase Premium Index has remained in the positive zone since November 28 shows that spot demand from US-based investors has increased. This metric, which measures the price difference between Coinbase and Binance, is positive, especially during periods when institutional investors buy from the USA.
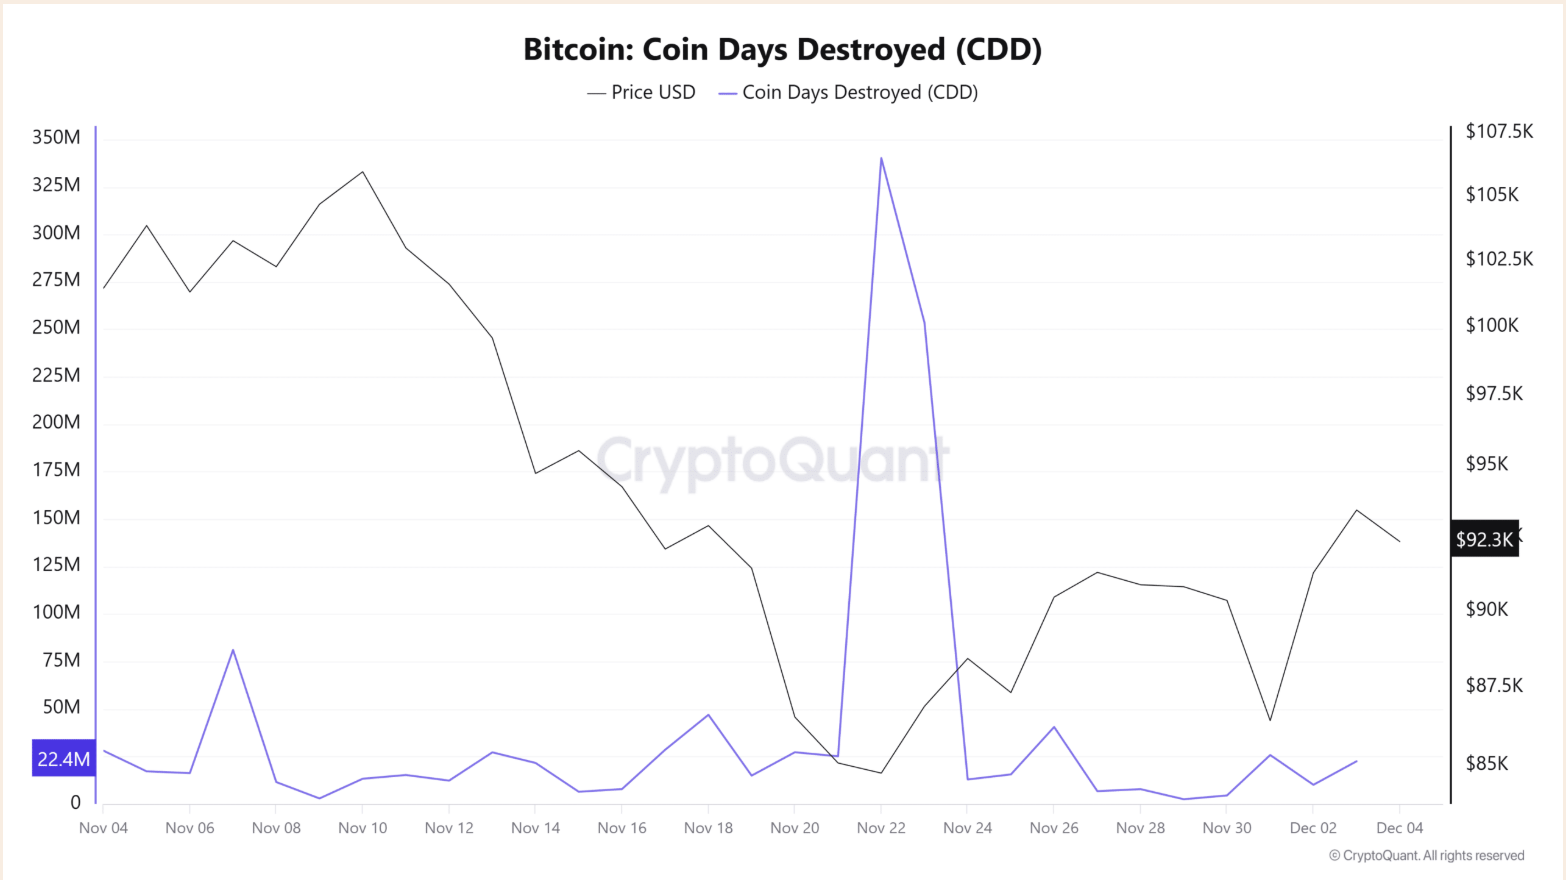
On the other hand, the Coin Days Destroyed (CDD) indicator, which tracks long-term investor behavior, has been quite calm for the last ten days. Sharp increases in CDD usually indicate profit taking by long-term investors. This silence shows that long-term investors are not yet heading for a mass sell-off.
On the other hand, in parallel with this process, it was emphasized in a Galaxy Digital analysis published last week that inflows to spot Bitcoin ETFs accelerated again in the last quarter of the year and that this acceleration played an important role in the price finding support. This revival seen on the ETF side, combined with on-chain data, indicates that the market is gaining strength.
As a result, the current chart shows that cautious optimism has emerged in the Bitcoin market. The Fed’s upcoming interest rate decision, ETF inflows and the calmness of on-chain indicators make investors think that “a new bullish cycle may be beginning.” However, some technical analysis indicators such as Elliot waves and volatility measurements suggest that the price may continue to fluctuate in the $90,000 band. As a result, although the possibility of a strong rally in Bitcoin is increasing, it is too early to say that a structural bull trend is certain without persistence above $ 106 thousand.