
As the crypto market struggles to carve a decisive path, the SAFE price struggles to sustain the recovery rally in motion. Following the sudden reversal and increased hopes of a bull run, the altcoin struggles to reach $1 amid a broader market correction.
Will the SAFE price reversal rally manage to surpass the 200 EMA to hit $1?
Sudden Brakes For A Bullish Recovery
In the 4-hour chart, the SAFE price action reveals a triangle breakout rally after a massive bearish trend. The bearish trend led to the generation of the overhead resistance line and resulted in multiple bearish reversals.
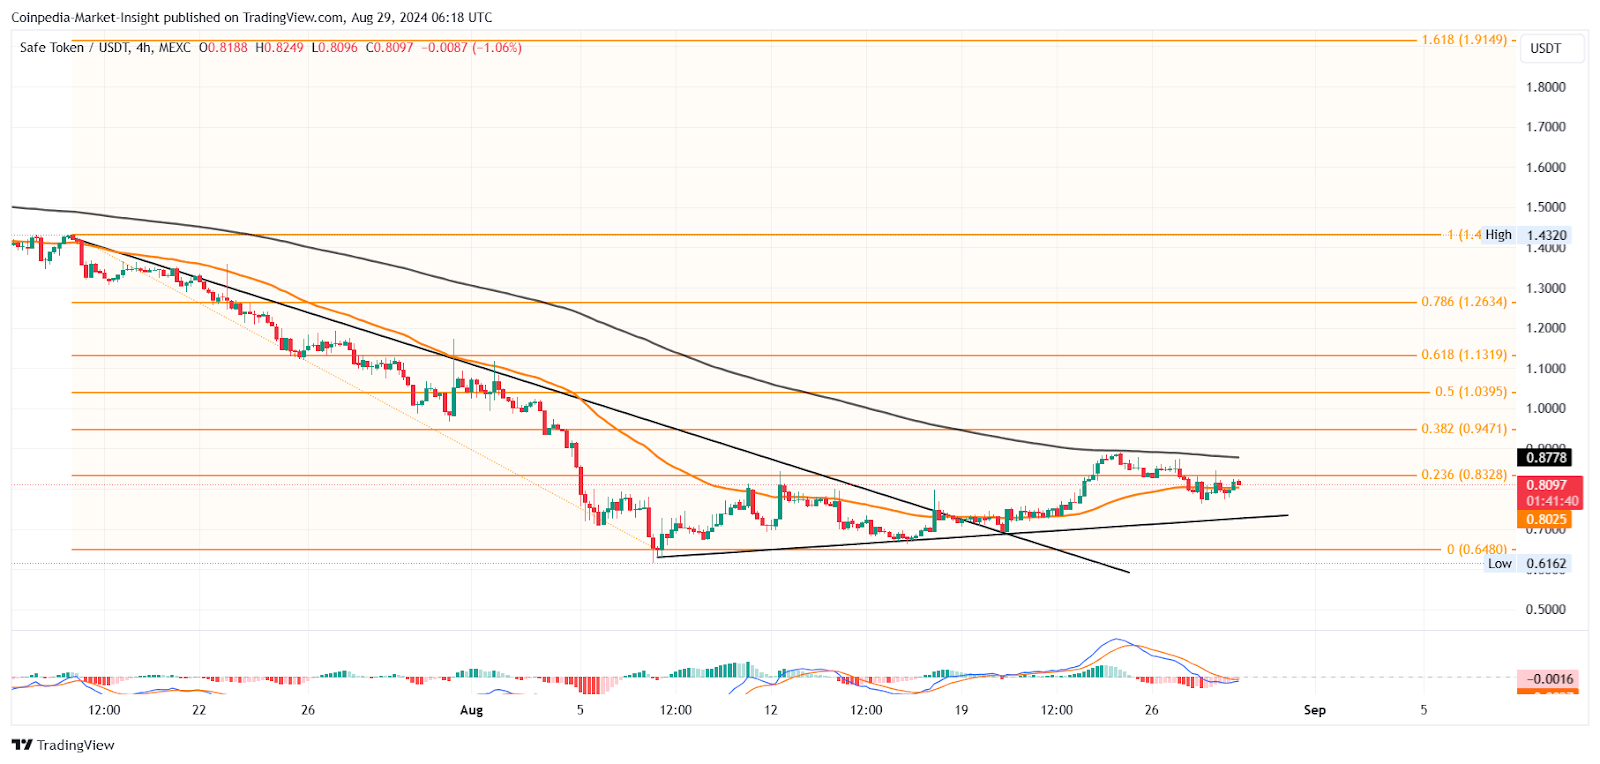
Furthermore, the 50 EMA, in alignment with the overhead trendline, acted as a dynamic resistance. The bearish trend accounted for a drop from the $1.4310 peak in July to the $0.6480 support level in August, accounting for a 54.76% price drop.
However, with the bullish turnaround forming a supporting trendline, the SAFE price formed a triangle pattern and led to a breakout run. Furthermore, a post-retest rally reclaimed the 50 EMA and challenged the 200 EMA at $0.89.
Retracing Fibonacci levels over the correction phase revealed a resistance level at $0.83, the 23.60% Fibonacci level. Currently, the pullback from the 200 EMA takes a stand at the 50-day EMA and struggles to surpass the 23.60% level.
The SAFE price also struggles to reclaim bullish momentum after the 8.68% drop, resulting in a bearish engulfing candle. Furthermore, the 4.58% jump since the price drop struggles to experience a higher price rejection from the 23.60% level.
Technical Indicators:
MACD: The MACD indicator in the 4-hour chart shows a bullish crossover impending in the MACD and signal line.
EMA: The consolidation between the 50 and 200-day EMA results in a decreased bearish gap, which increases the possibility of a golden crossover.
Will SAFE Price Hit $1?
A bullish reversal above the $0.83 mark could result in a 200 EMA breakout and challenge the 38.20% level at $0.94. In case of a broader market recovery, the SAFE price could find overhead resistances at the 50% and 61.8% levels at $1 and $1.13, respectively. On the flip side, the support levels are at $0.70 near the trend line and $0.64.
Check the price prediction of SAFE’s top rival ZCash (ZEC)