
The number two altcoin in the cryptocurrency world Ethereum’s It was seen that there was a significant price drop in the last 30 days. As of writing time, ETH, which found buyers at $ 2,529 after a 1% increase in the last 24 hours, was seen to have decreased by 2.52% in the last 7 days. This general price decline caused the whales to sell off their Ethereum in the last few weeks to be reflected in the graphs.
What Did Ethereum Do?
ETH In parallel with the double-digit declines experienced in the last 30 days, ETH whales appeared to have experienced a decline in trading activity over the past 30 days. A Prize Pool Worth 21 Million TL Awaits You from BinanceTR! Participating and winning has never been easier.. You can sign up to BinanceTR from this link. Get your first crypto!
This can also be seen from the decrease in the number of large transactions made by ETH in the last month. According to data provided by IntoTheBlock, the daily number of ETH transactions worth between $1 million and $10 million decreased by 5% during this period. At the same time, the number of daily transactions over $10 million decreased by 45%, as reflected in the graphs.
On the other hand, the net flow of whales for Ethereum was seen to have decreased by 77%. Large holders, or in other words whales, can be defined as a group of investors who own more than 0.1% of the asset’s circulating supply. The net flow of large holders can be interpreted as a reflection of the difference between the amount of ETH these whales bought and sold in a given period.
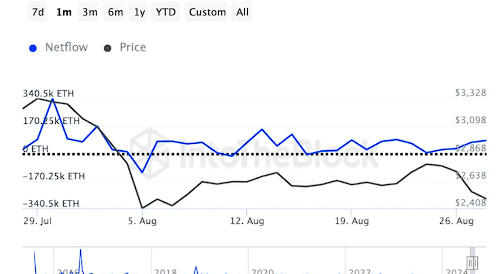
When large holders experience a decline in their net flow metric, it is widely believed that whales are reducing their holdings, and this is often interpreted as a sign of a downtrend. This can often precede larger price declines, as a decline in whale transactions can have a negative impact on market sentiment.
ETH Price Prediction
Ethereum’s Moving Average Convergence Divergence (MACD) is moving towards a crossover below the MACD line (blue) and the signal line (orange), which could be a bearish indicator. A crossover generally indicates a strengthening downtrend and reinforces the view that traders are going through one of the most important periods to consider selling or taking profits.
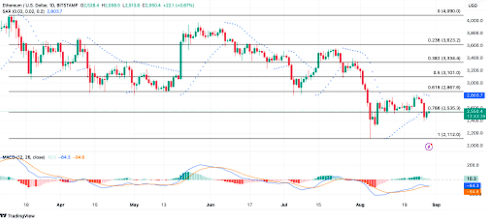
A possible increase in selling pressure, ETH’s The price could indicate a pullback to the $2,112 level seen on August 5. On the other hand, if there is a reversal in the market trend and an increase in buying activity, the price could potentially return to $2,867.
Disclaimer: The information contained in this article does not contain investment advice. Investors should be aware that cryptocurrencies carry high volatility and therefore risk, and should carry out their transactions in line with their own research.