
We may not see the immediate results of every big and good news on the price chart. One of the best examples of this was BlackRock’s BTC ETF application. At that time, the world’s largest asset manager’s ETF approval score was almost 100% out of 500+ applications. And many people BTC ETF He knew that the company made this application because it was sure that it would get approval. However, we did not see the effect of this on the chart immediately. So what are the latest predictions for BTC, AMB and altcoins?
Bitcoin (BTC)
Last year BlackRockLet’s remember the days when ‘s ETF application was made. We saw some PhD experts commenting that BlackRock’s entry into crypto would cause a collapse. However, BlackRock and other asset managers were holding the assets purchased by their clients in their reserves, that is, they were directly involved in Bitcoin as a company. $63,421The story that they would amass hundreds of billions of dollars in assets to destroy was utterly ridiculous.
Since we did not immediately see the BlackRock effect on the chart, some people believed this nonsense. Then BTC exceeded the levels of 30, 40, 50, 60 and 70 thousand dollars. It reached an all-time record level. This did not happen in a few days, it took months. We can say that a similar process started with the Fed’s interest rate cuts.
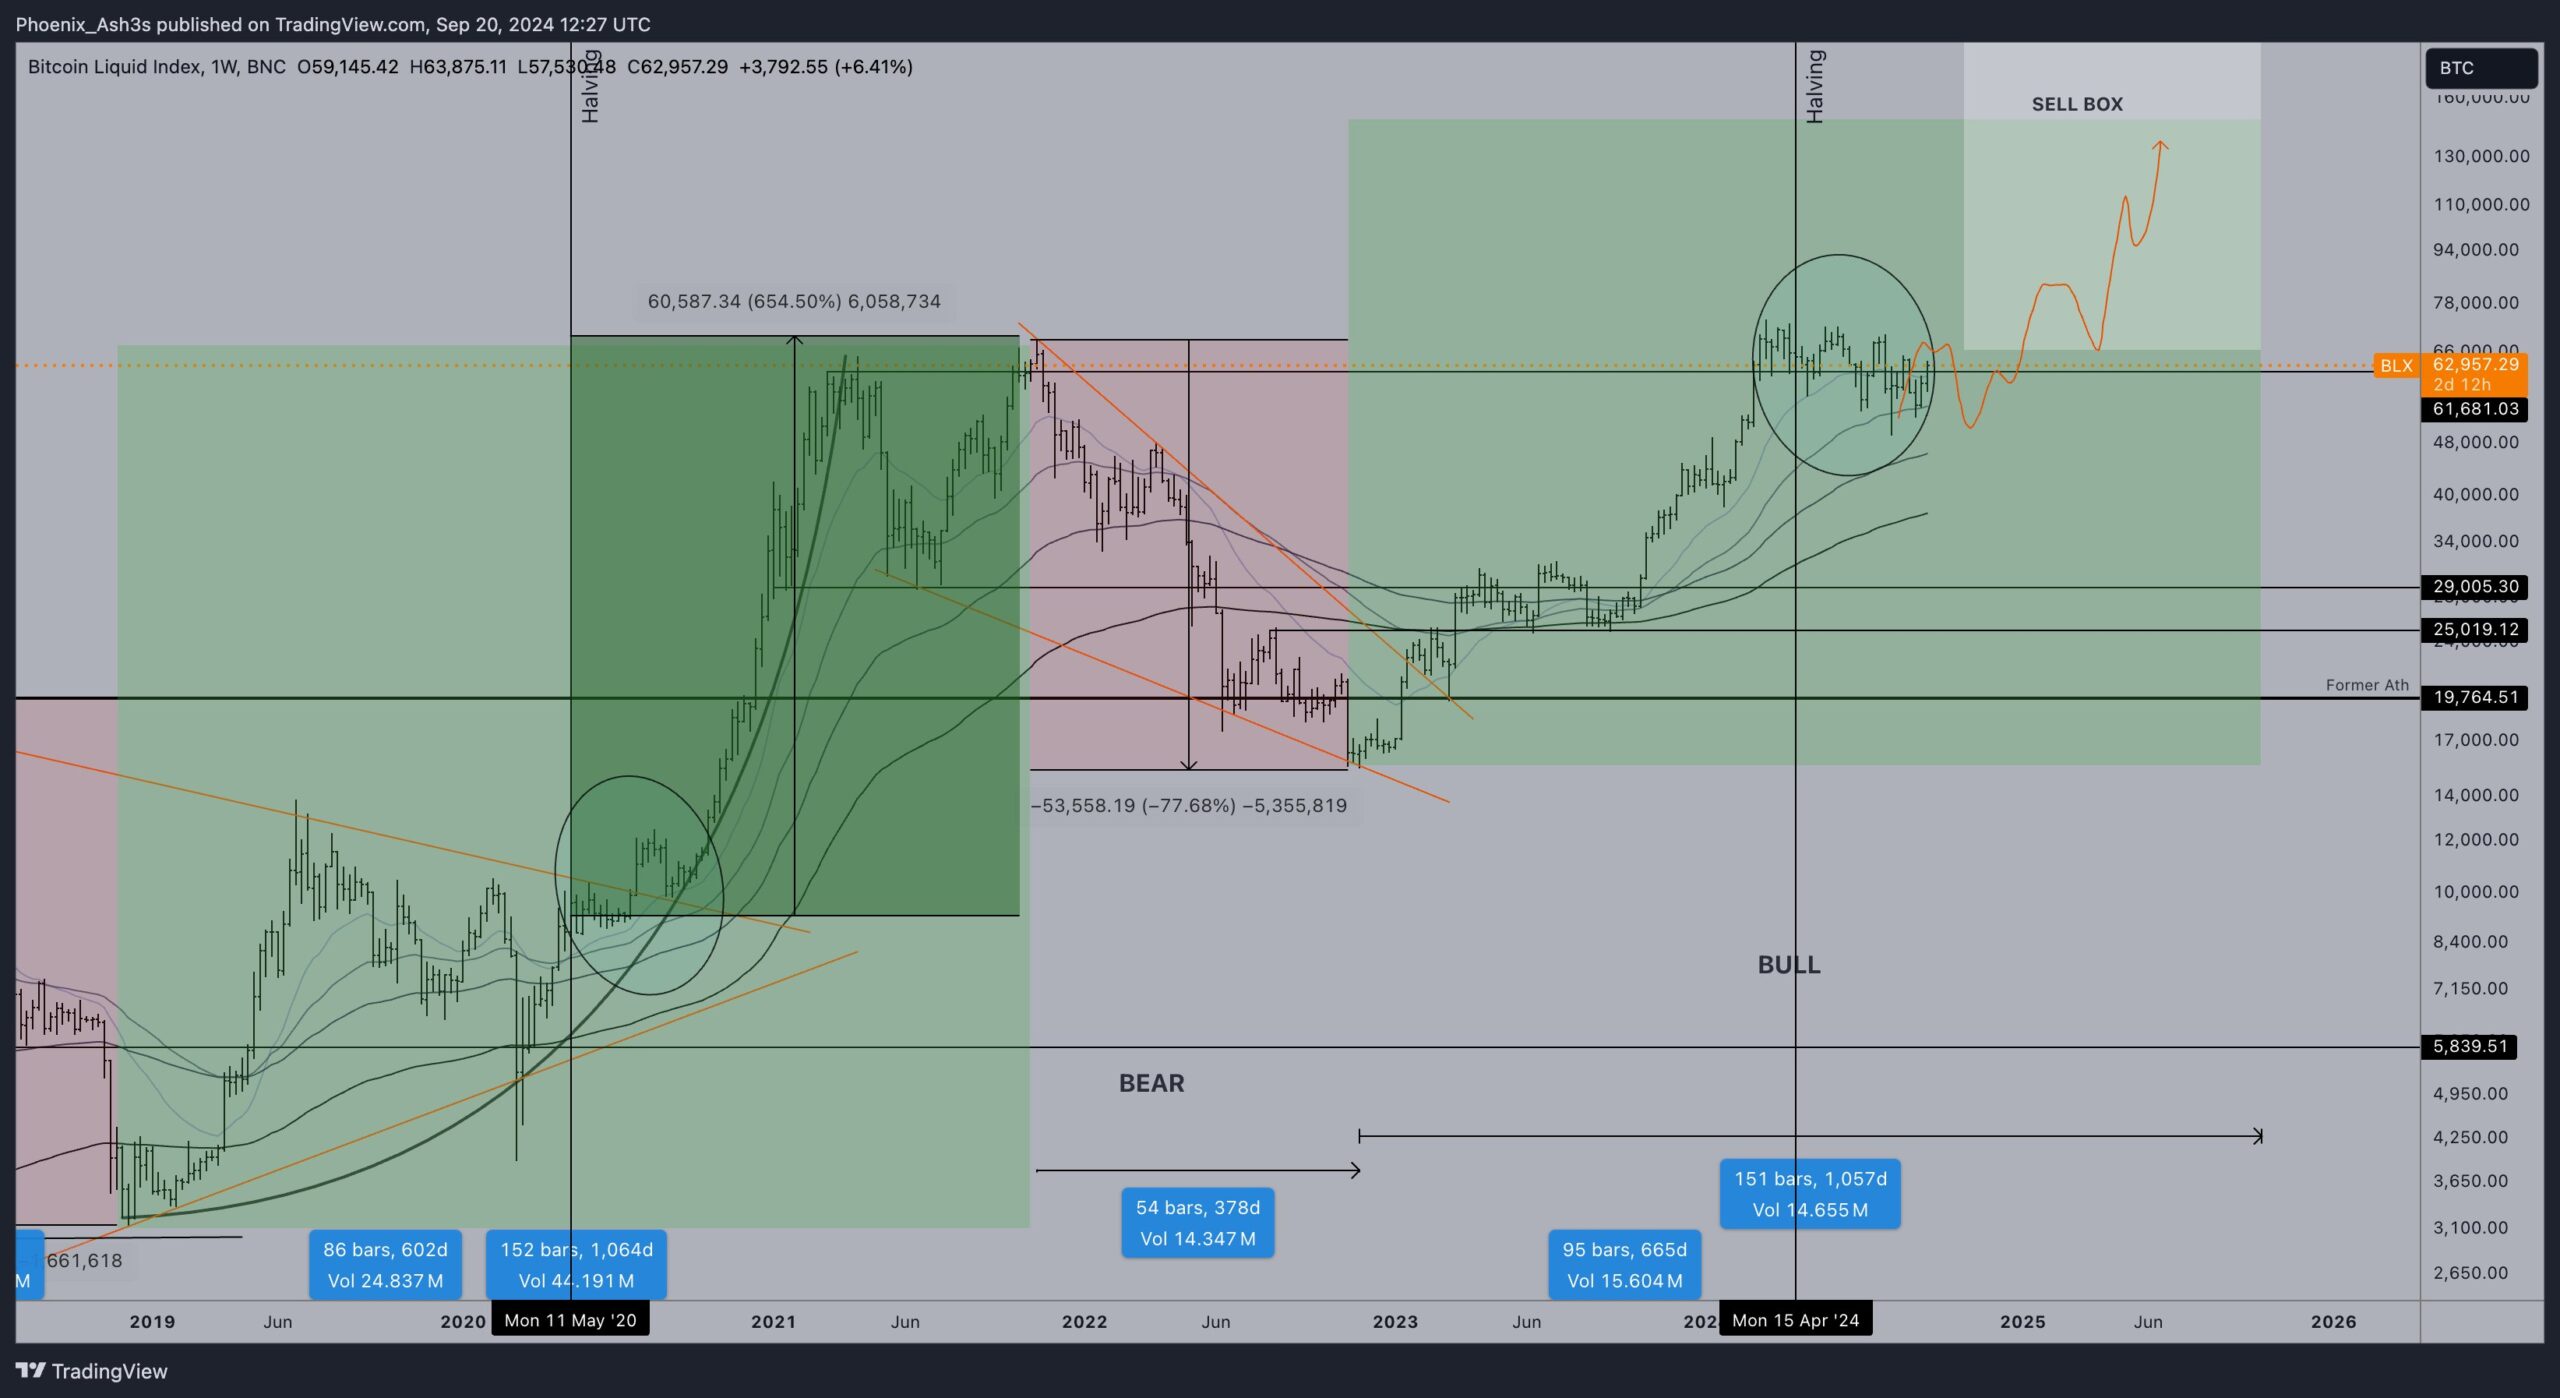
Cryptocurrency Analyst Phoenix shared the chart above, reiterating his bullish outlook based on historical data as the king cryptocurrency finds support above the 21-week EMA after the halving.
“In the last 4-year cycle, #Bitcoin, halving After the correction, it found support at the 21-Week EMA.
This time we found support at the 50-Week EMA. $BTC is about to close above the 21 EMA again. The future is bright, make sure you are prepared.”
Altcoins and AMB Coin
The second largest known as Nagato cryptocurrency analyst He does not recognize the current totalcap chart as a work of art. The expert, who says that he has difficulty understanding those in a downtrend, argues that the chart reflects a lot of uptrend potential for three reasons. One of these three reasons is the bull flag and cup-handle formation. The other is the bounces seen from the 61.8 and 50% Fib levels (+ important FVGs).
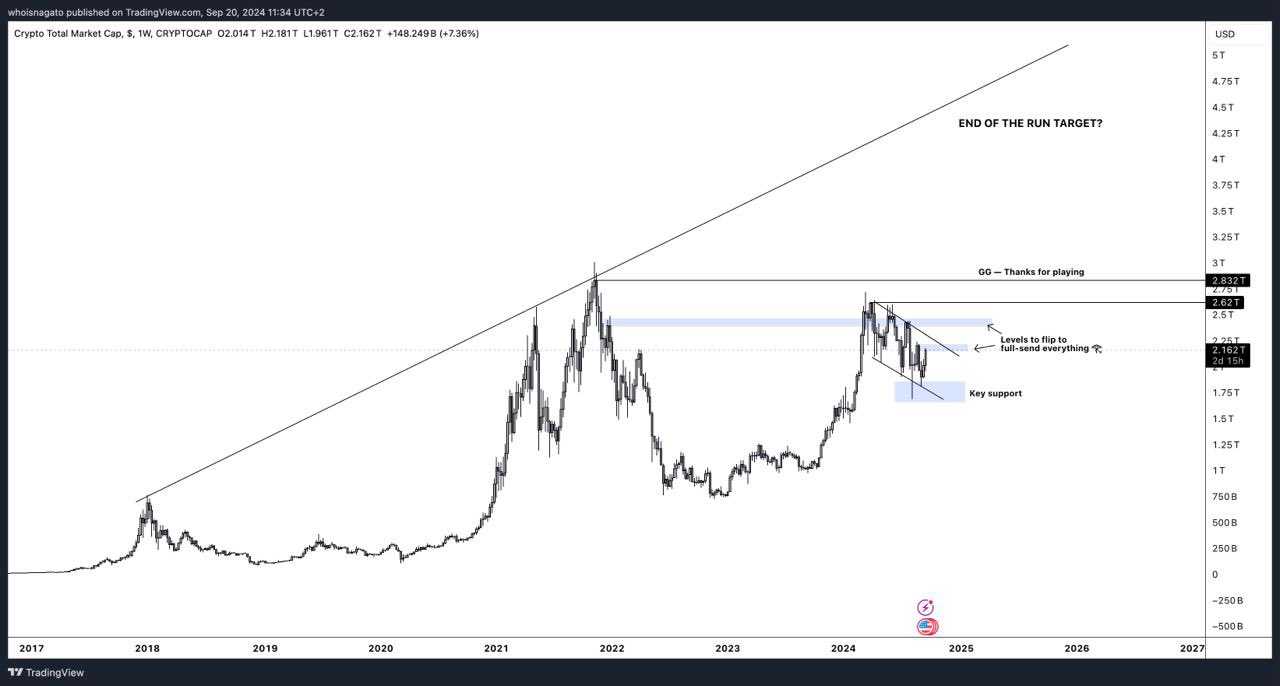
In addition to all this, he says the following;
“Is it enough? I could go on with other indicators I use, but let’s keep it simple. As you probably already know, my personal opinion is that the crypto market will easily melt the resistance zones you see on the chart – it will go much higher and much faster than most people can imagine. It has been accumulating for months – all we need is for $BTC to break out to new highs and then the snowball effect will be insane.
“That said, I haven’t seen a parabolic rally without some brutal corrections along the way. So be prepared for volatility.”
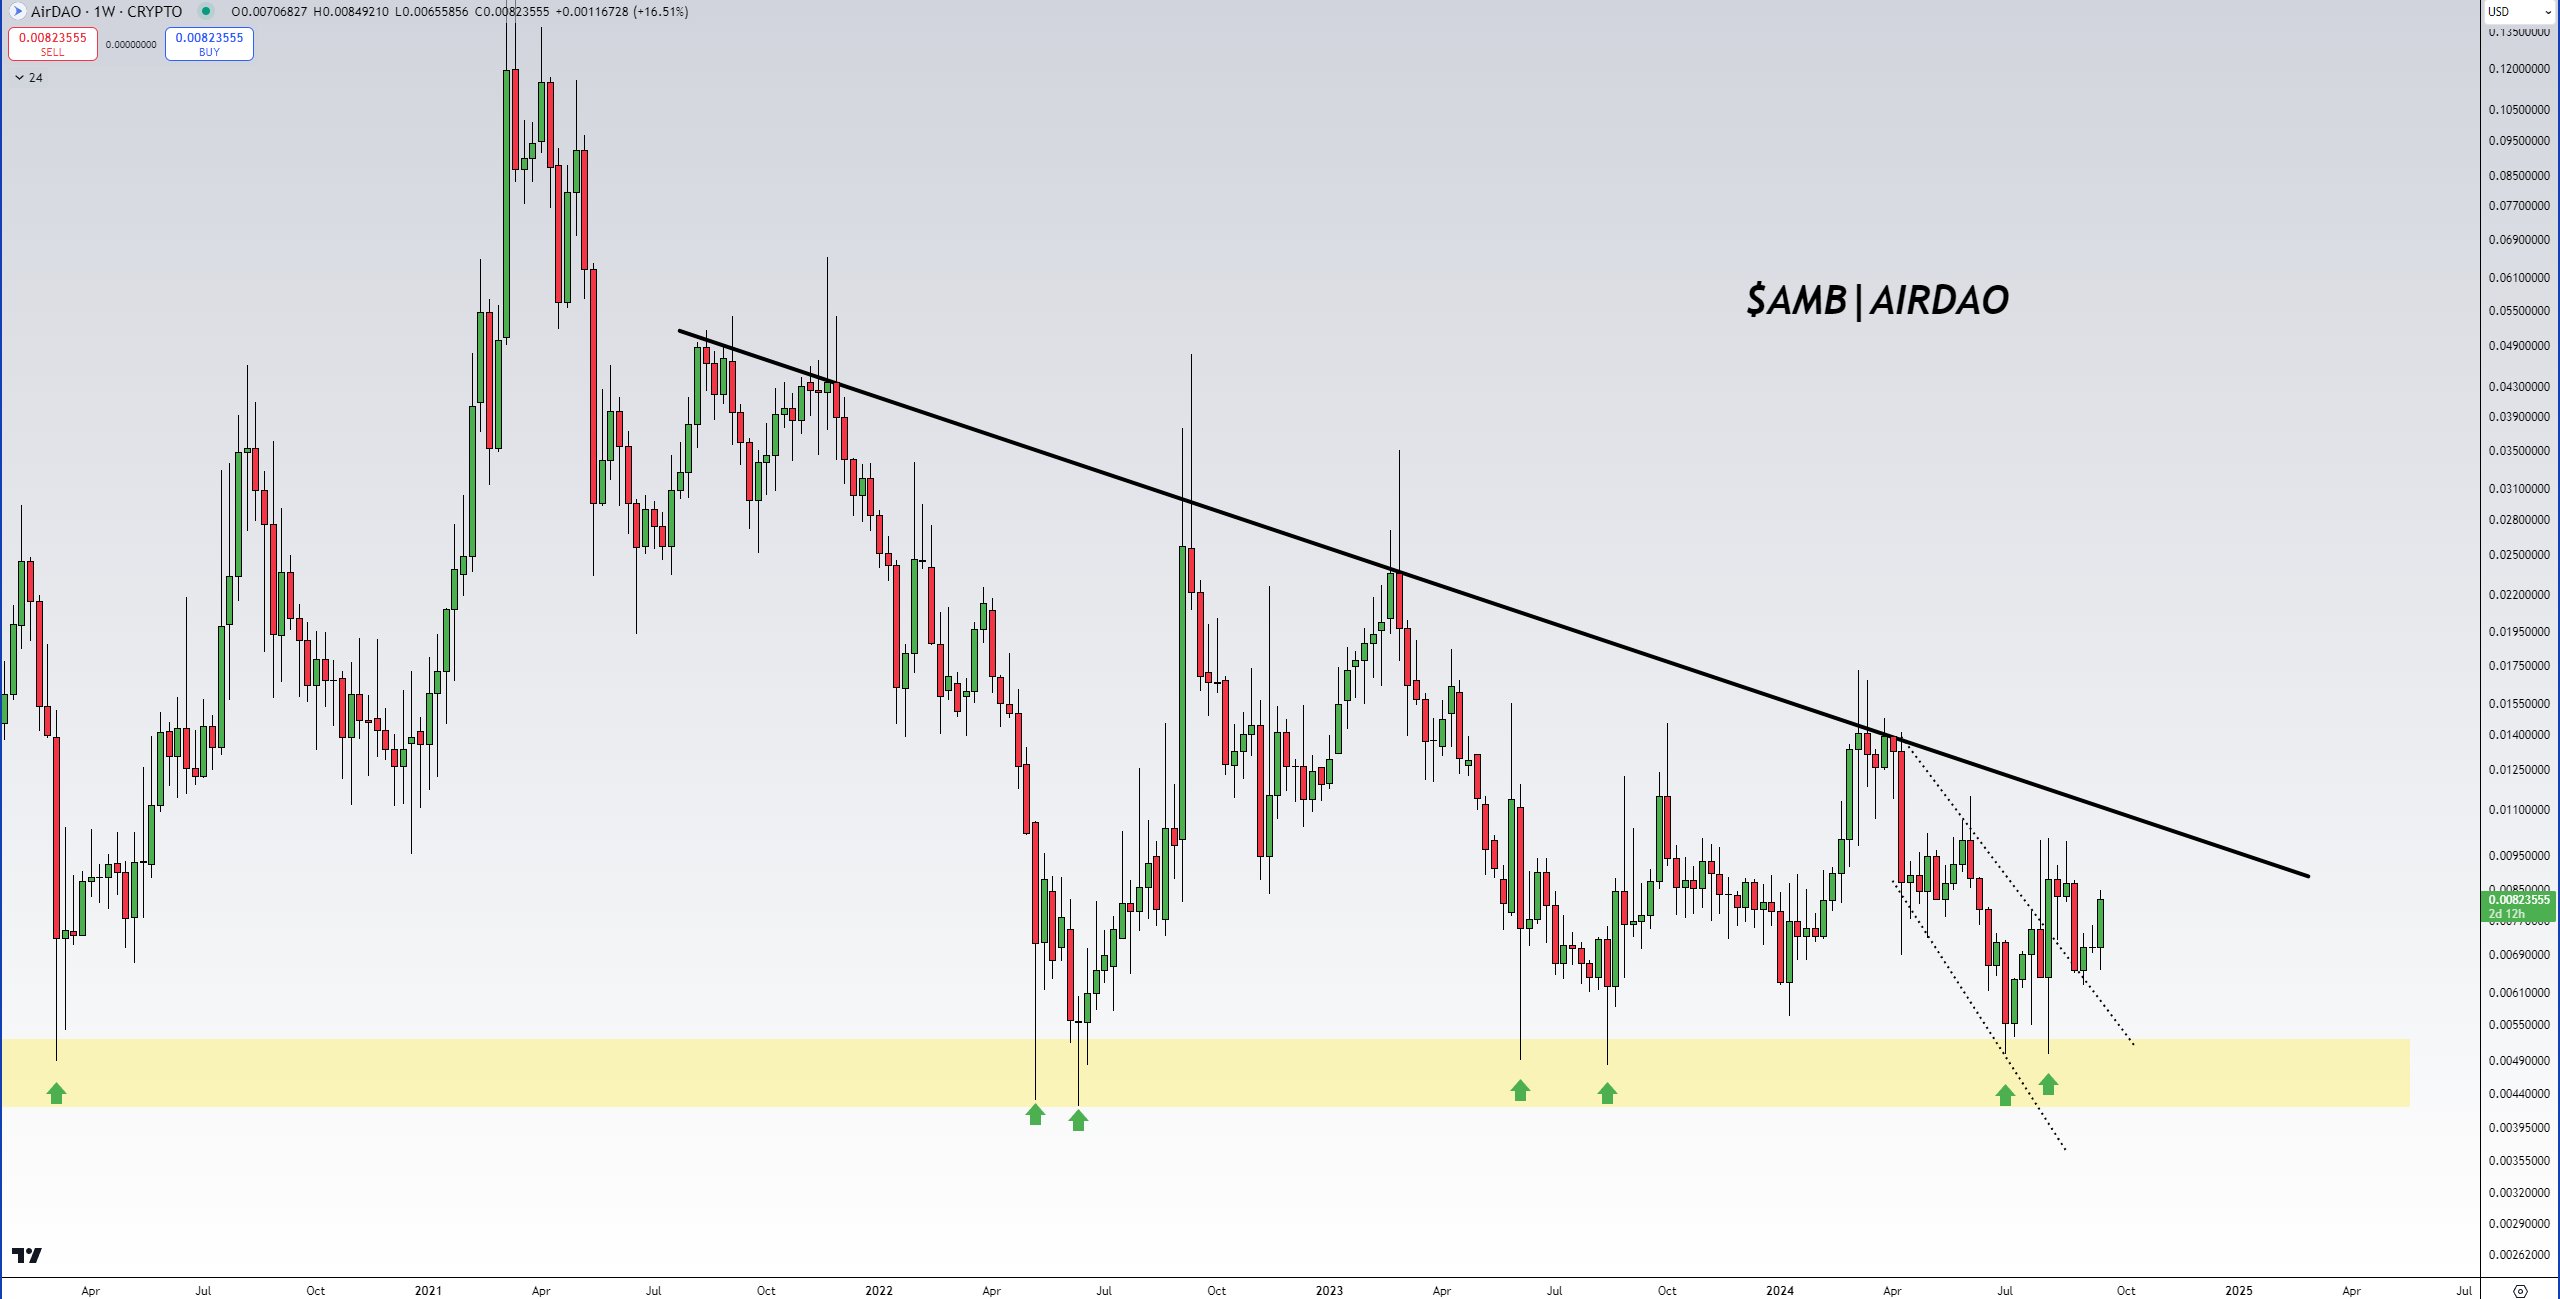
Finally, the third, known by the nickname Mustache crypto money analysts believe that the downward trend that has been going on for years is now AMB Coin He wrote that the end has come for . The analyst who shared the chart below argues that liquid staking will come soon and this could be the trigger for the rally.
Disclaimer: The information contained in this article does not contain investment advice. Investors should be aware that cryptocurrencies carry high volatility and therefore risk, and should carry out their transactions in line with their own research.