
Bitcoin fails to hold its downfall, even when $60,200 supported it multiple times. But this time, it looks like this support zone is exhausted and BTC will fall down to $53,000. The largest cryptocurrency has fallen almost 9% from its peak of $66,00 four days ago. Even though the various support levels tried their best to hold the price but failed. It is only the moving average 200 that has been preventing further fall.
At the time of writing, bitcoin is trading at $60,375 and MA 200 is trying to hold it from tripping down. The four hourly chart shows us that the falling price has penetrated the moving average multiple times and it might not be able to hold the price any further.
Just below this moving average lies the $60,000 which has been a great help multiple times but looking at the RSI it looks like this price area is also going to be helpless in front of bears this time.
The daily chart shows a double bottom. Typically this pattern appears in a downtrend and signals a reversal. However, this time the formation of this pattern in an uptrend is a complicated phenomenon. But it did its thing. It made the price fall down. Both of its bottom lie on $53,600 suggesting we can see the price to reach there.
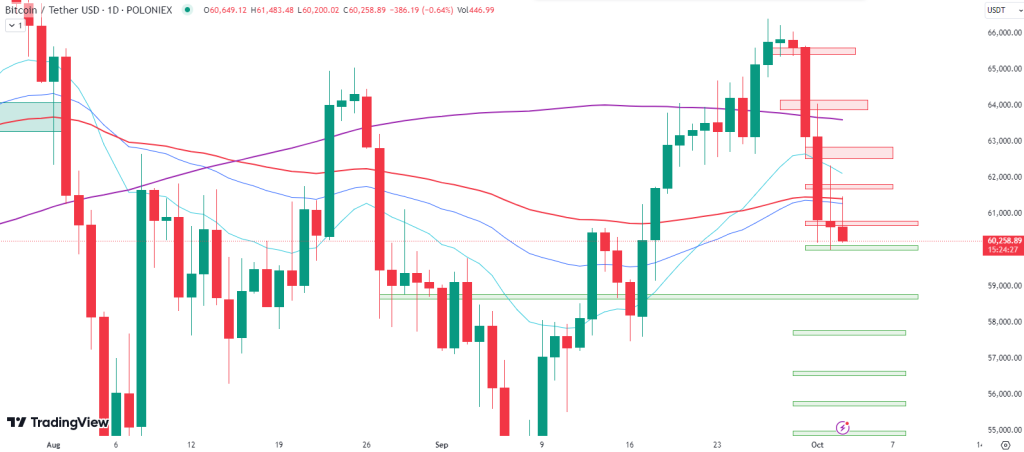
There is a great zone that might be able to stop the free fall of bitcoin price. This zone lies around $58,000 and just like $60,000, it has also prevented huge falls in the past. If bulls fails to bring in more power, we might not be able to see the bull run soon that the community has been waiting for a very long time.
Also Read : XRP News: Santiment Shares Insight About Bitwise’s ETP Plan