
Ethereum $2,697.21 (ETH) is on the brink of exiting the long -standing down trend. However, price movements are still uncertain and critical support levels are tested. Elliott wave analysis and Fibonacci projections can help us understand Ethereum’s next move.
What does the technical look say for ETH?
Ethereum‘s daily price graph shows that after reaching a level of 4 thousand 100 dollars on March 11, it has entered the correction process. Elliott wave count shows that the price began to recover after declining to 2 thousand 150 dollars on February 3.
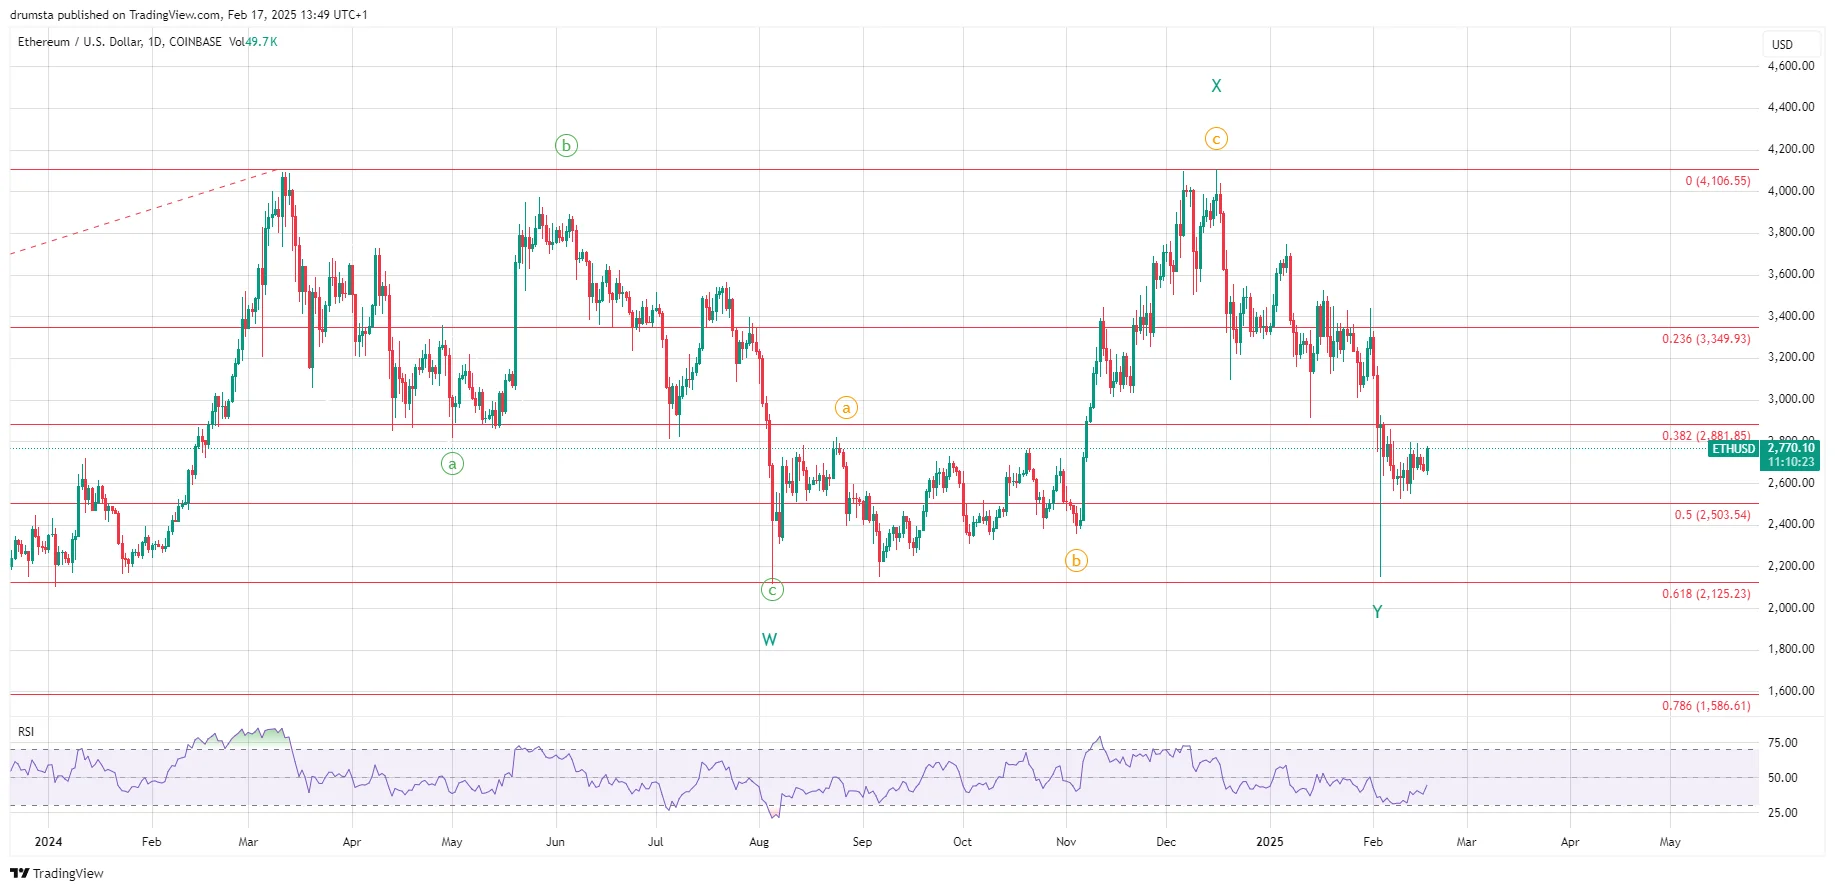
According to Fibonacci correction levels Eth On February 4, he tested the level of 0.382 Fibonacci of $ 2,881, and this region is currently working as a resistance. The market structure shows that it is trying to stability between 2 thousand 700 and 2 thousand 800 dollars.
On a single screen instant prices, important data, news, latest developments, comments and discussions at Chat! Come right away from your eyes!

Ethereum gives hope to recover from a critical support level of 2,000 503 dollars. This level coincides with 0.5 fibonacci correction and attracts attention as a historically strong demand zone.
Daily graphic Relative power indicator (RSI) follows a neutral course. Neither excessive purchase nor excessive sale indicates that the price can move in both directions. Ethereum’s most important test in front of me will be to get back the 0.236 Fibonacci level of 3 thousand 349 dollars. If this region can be overcome, a new rise movement may begin. However, a closing price below 2 thousand 700 dollars can decline up to 2 thousand 503 and even 2 thousand 125 dollars.
Which scenarios come to the fore in the price of Ethereum?
Ethereum, on January 31, the fall from the decline channel rose to 3 thousand 430 dollars. However, he then experienced a deeper correction. Ethereum five wavy according to hourly graph Elliott FormationIt may be in the first stages of. The first wave was completed on February 3 at 2 thousand 881 dollars. The second wave can find around 2 thousand 700 dollars.
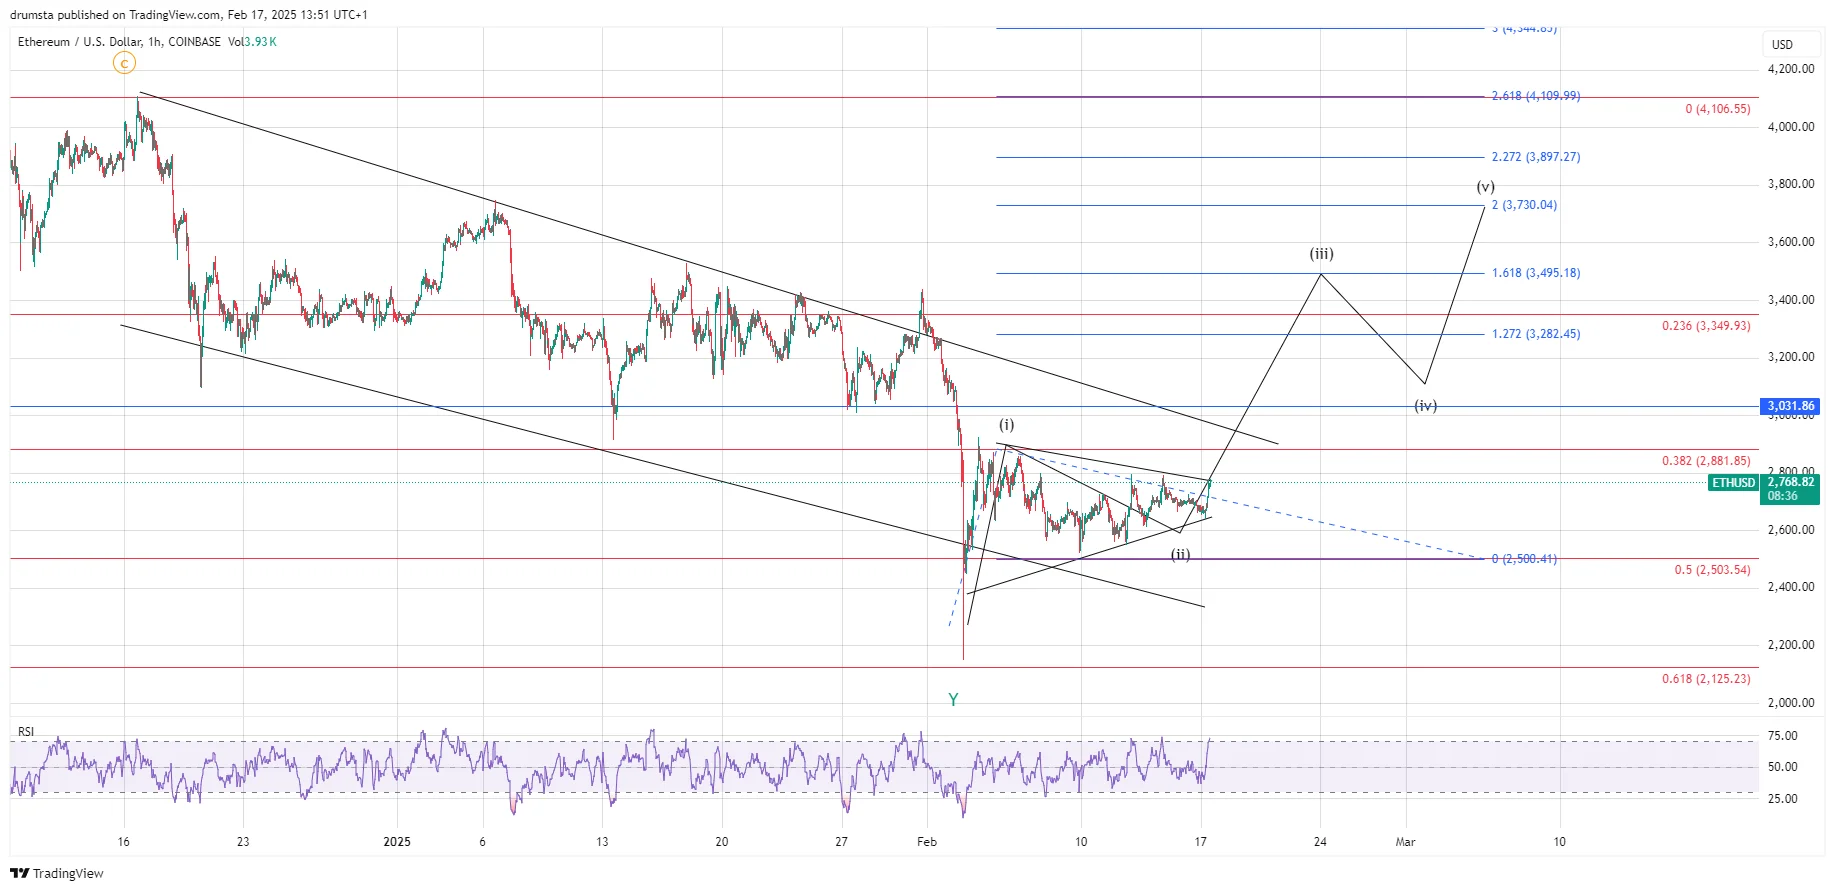
If the third wave occurs and the rise gains speed, the target can be 3 thousand 495 dollars. This level corresponds to the 1.618 fibonacci extension point. If Ethereum maintains this acceleration, it may rise up to 3 thousand 730 dollars in the fifth wave. There is a 2.0 Fibonacci extension here.
However Ethereum priceThere are also risks. If the support of 2 thousand 768 dollars is broken, a withdrawal can be seen up to 2 thousand 503 dollars. Raning below this level may invalidate the rise scenario. In the hourly graph, the RSI indicator shows a slight bull decomposition. However, for a definite rise, the price must be permanent over 2 thousand 881 dollars.
Responsibility Rejection: The information contained in this article does not contain investment advice. Investors should be aware that crypto currencies carry high volatility and thus risk and carry out their operations in line with their own research.