
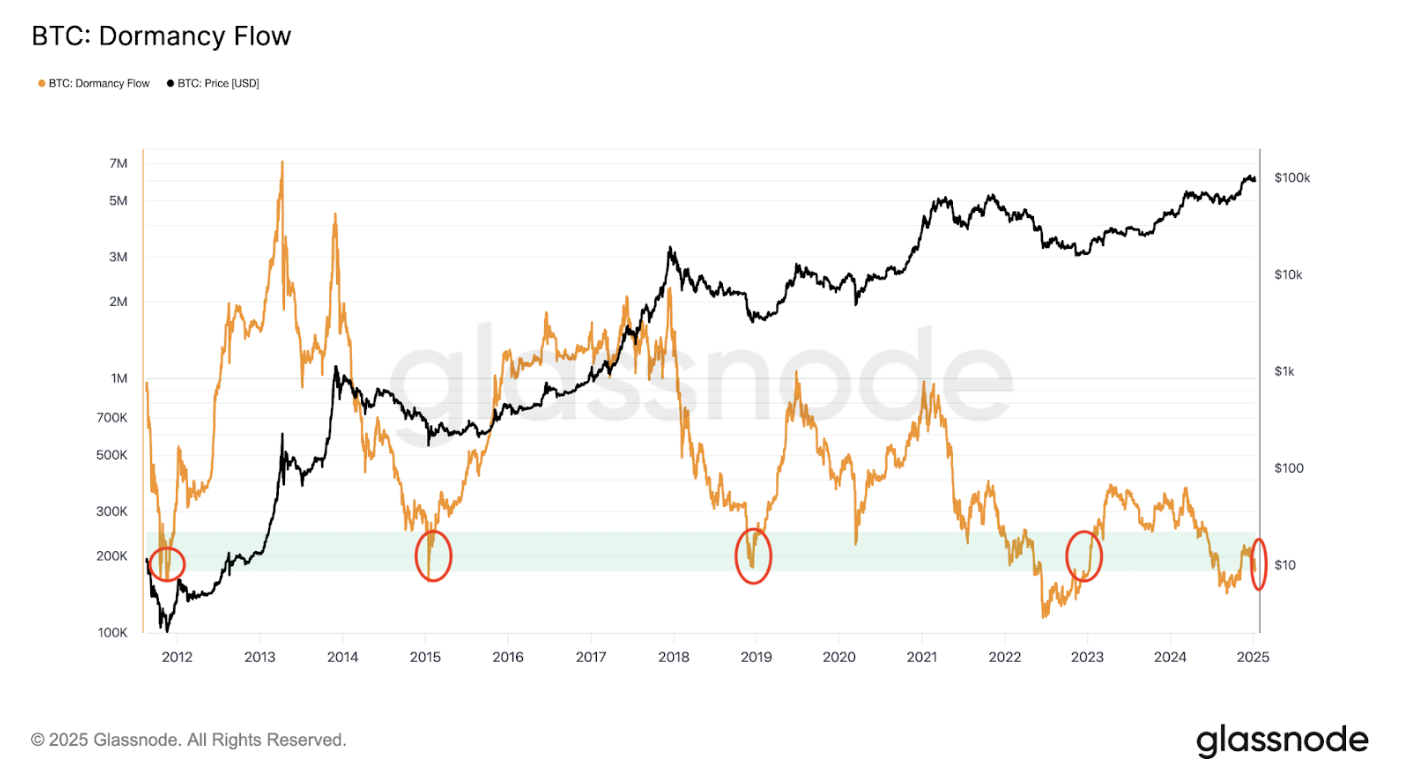
Bitcoin  $116,250.69 After the price fell to 108,650 dollars last week, it showed a recovery of about 5 percent from this point. Three important indicators in the market indicate that this level may be a short -term bottom. Especially the fact that the Entity-Adjusted Dormancy Flow indicator to 133,300 shows that it is historically known as the “good purchase zone”. Entity-Adjusted Dormancy Flow deals with the perspective of “who sells, who is buying” in the Bitcoin market. It is considered reliable in terms of bottom and peak signals, especially since it reveals the movements of long -term investors.
Data strengthens the bottom signal
Previously, the recovery, which started from these levels, had been the beginning of great rise rally. A similar table took place in July 2021 and Bitcoin reached a record of $ 69,000 in a few months.
On the other hand, Glassnode, the On-Chain Analysis Platform, announced that the net-unrelated profit/loss rate of short-term investors has returned to negative. This shows that investors holding Bitcoin less than 155 days are mostly damaged and sales pressure may increase. However, such “capitulation zones” historically paved the way for new purchase waves in the markets. A similar painting, which was seen at the levels of $ 75,000 in April, paved the way for the price to reach 65 percent in a short time to reach $ 124,500. Crypto analyst Jack also shared his X account, “This installation points to the early procurement period,” he said.
V-Formation in technical view
On the technical side, a 12 -hour graph attracts a V -shaped formation. Bitcoin, since September 18, a decrease of 7.8 percent to 108,700 dollars after decreasing a strong recovery. The relative Power Index (RSI) from 27 to 53 shows that the rise momentum has increased. Analyst Matthew Hyland said that in addition to a dual foot formation in the daily graph, the inverse shoulder-head-omuz model also pointed to potential breaks. A similar technical view recently Ethereum  $4,287.68 It was also observed and the ETH price had increased to $ 4,100.
The critical resistance level for Bitcoin stands out at $ 118,000. If this level is exceeded, the price is expected to move back to the summit of $ 124,500. For investors, this process can be regarded as a period in which the market collects power again. However, in this process, where volatility is high, investors need to be careful in short-term AL-SAT strategies.
As a result, historical data, On-Chain indicators and technical analysis indicators indicate that Bitcoin is close to the bottom levels. However, since such signals do not always give a definite results, it is of great importance that investors move cautiously and determine long -term strategies.